Plenty of predictions for the “end of branches” have come and gone and never panned out. At times the branch “dinosaur” defied the prognosticators and not only lived, but increased in numbers. Is this time different?
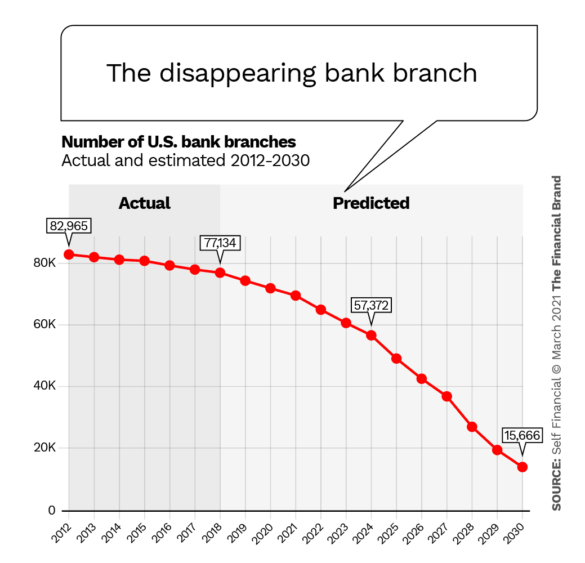
Many factors are different now and a new and detailed analysis of branch closing data by Statista, commissioned by Self Financial, suggests a significant change. According to the report based on the analysis, the number of bank branches in the U.S. fell by 6.5% from 2012 to 2018. That’s an average of 902 a year. For every 15 branches open in 2012, one is now closed.
More importantly, the rate of branch closures has been doubling every three years. Between 2012 and 2015, the closure rate was 0.81% per year. From 2015 to 2018 the rate reached 1.6% per year. Based on that and other factors, Self predicts that by 2027 there could be fewer than 40,000 branches across the U.S. and by 2030 fewer than 16,000 remaining. That would put the number of branches at that point at 1965’s level. From there it’s just a short statistical step to zero.